Blog
Unlock Growth with Channel Attribution: Your 2026 Guide
Published July 23, 2026

You can feel it on day one. Meta Ads Manager says one thing, Shopify says another, Google Analytics adds a third version, and you're left wondering which screen is lying to you. If you're a solo founder, that confusion can make every budget decision feel expensive.
Channel attribution is the practical way out of that mess. It's the process of deciding how much credit each touchpoint gets for a sale, so you can stop treating every dashboard like a separate reality and start making budget calls with some confidence.
The hard part is that no platform sees the whole customer journey. Some only see their own clicks and views, some see tagged sessions, and your store only sees the order. That's why the core job isn't “find the perfect number,” it's build a good-enough measurement stack that helps you know what to scale, what to pause, and what to test next.
Table of Contents
- Why Your Ad Reports Never Seem to Match
- How Attribution Models Assign Credit to Your Ads
- Why Perfect Attribution Is a Myth in 2026
- Your Good-Enough Ecommerce Attribution Setup
- How to Interpret ROAS and Allocate Your Budget
- Testing for True Impact with Incrementality
- Your Channel Attribution Action Plan
Why Your Ad Reports Never Seem to Match
Meta says the ad drove the sale. Shopify says the sale came through a different source. Google Analytics shows a path that looks more complicated than either of them. That mismatch isn't a sign that your store is broken, it's usually a sign that each system is assigning credit differently.
A founder can get stuck trying to reconcile every line item, but that's the wrong fight. Channel attribution is the framework for understanding why one channel gets credit in one place and loses it in another. If a customer first notices your product in an Instagram Reel, searches your brand later, then buys after a direct visit, each platform may claim a different part of the win.
What the mismatch usually means
The fix starts with a mindset shift. Instead of asking, “Which dashboard is right?” ask, “What credit rules is each dashboard using?” Google Analytics' attribution reports show that the industry has already moved beyond a single answer, with models like paid and organic last click and Google paid channels last click built to assign credit in different ways Google Analytics attribution reports.
For a new store, that matters because your ad platform is often optimized to win the sale it can see most clearly, while your ecommerce backend records the final order. Neither view is useless. They're just answering different questions.
Practical rule: When Meta and Shopify disagree, don't assume one is wrong. Assume they're measuring the journey from different angles and use the gap as a signal, not an emergency.
A clean way to think about it is this. Meta may be good at showing which campaigns created demand, while Shopify is better at telling you what revenue cleared. Google Analytics sits in the middle, translating tagged traffic into journey-based reporting. If you want a primer on the metrics that sit underneath those reports, this breakdown of ad performance metrics is a useful companion read.
The goal isn't perfect agreement. The goal is to understand which source of truth is strongest for which decision, so you don't pause a promising campaign just because one dashboard is more conservative than another.
How Attribution Models Assign Credit to Your Ads
Attribution models are credit rules. In a soccer match, one rule gives all credit to the striker who finished the play, another gives more weight to the winger who started the move, and another spreads credit across the full sequence. The sale is the goal, and the model decides how the assist gets counted.
That is why the same campaign can look strong in one report and only average in another. Google Analytics makes that difference visible by offering multiple attribution models, including paid and organic last click, which gives 100% of the key-event value to the last clicked channel, and Google paid channels last click, which also gives 100% but falls back to paid-and-organic last click when there is no Google Ads click in the path Google Analytics attribution reports.
The main models new founders actually encounter
Here is the version that matters for budget decisions. Each model answers a different question about where revenue came from.
| Attribution Model | How It Works | Best For | Potential Blind Spot |
|---|---|---|---|
| Last Touch | Gives all credit to the final interaction before purchase | Simple reporting and fast-read decisions | Undervalues awareness and consideration |
| First Touch | Gives all credit to the first interaction | Understanding what creates demand | Ignores what closed the sale |
| Linear | Splits credit evenly across touchpoints | Seeing the full journey at a basic level | Treats weak and strong touches the same |
| Data-Driven | Uses observed journey patterns to assign credit | Accounts for more of your actual path data | Needs enough history and clean tracking |
A campaign that introduces the buyer to your brand may deserve some credit even if it did not close the order. The closing ad may also be doing important work without being the first touch. Solo founders need both ideas in view, because a channel that looks weak under last click can still be doing useful demand generation.
What each model hides
Bottom line: Every attribution model is a lens, not a truth machine.
Last touch is popular because it is easy to read. It also tends to over-credit the channel that happened to finish the journey. First touch does the reverse, giving too much weight to the channel that created the first spark while ignoring the persuasion that happened later. Linear feels balanced, but it can blur the differences that matter when you are deciding where to spend next.
Data-driven models are more nuanced, but they still depend on the quality of the data underneath them. For a new founder, the question is not which model is scientifically perfect. It is which model helps you make a better next decision than gut feel alone.
The practical move is to keep one model for day-to-day reading, then sanity-check it against revenue and simple experiments. That gives you a view that is good enough for budget calls without pretending the numbers are cleaner than they are.
Why Perfect Attribution Is a Myth in 2026
Perfect attribution sounds clean until you consider how people buy. Someone might see your ad on a phone, compare products on a laptop, click a remarketing ad from a tablet, and then buy later through a browser with limited tracking. That path exists in fragments, not as one neat line.
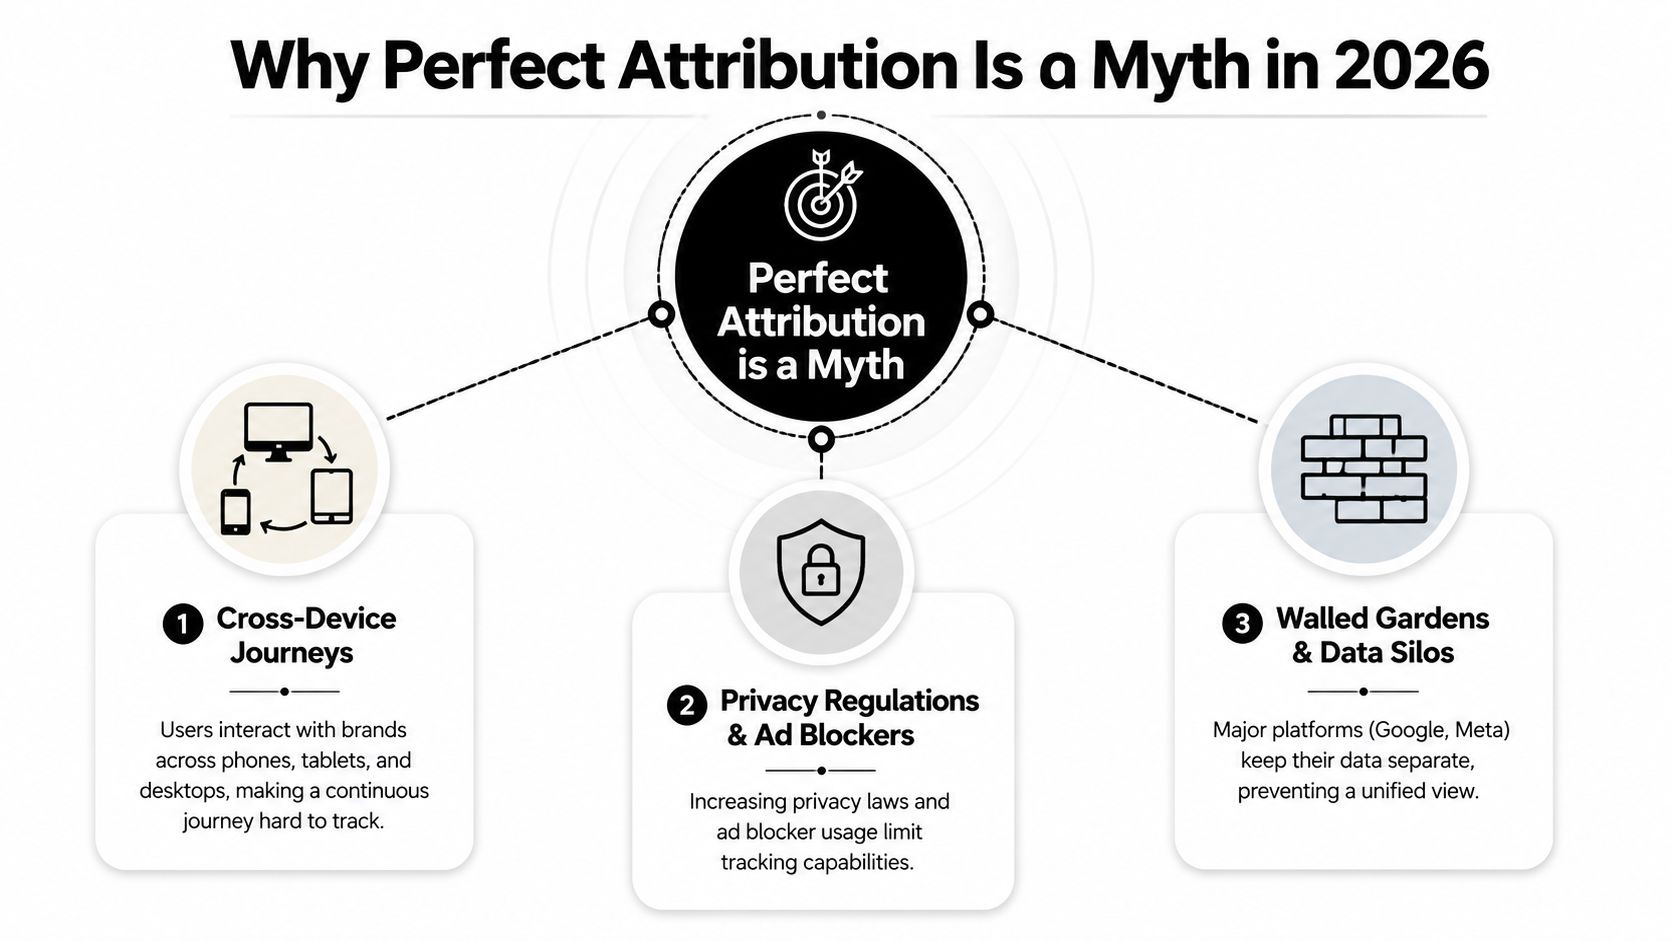
Recent 2026 guidance calls out fragmented customer journeys, privacy-related signal loss, and cross-platform reporting inconsistencies as the main reasons attribution breaks down, and it argues that a consistent system of record matters more than model sophistication for relative comparison Braze on attribution challenges.
Why the data gets messy
The biggest problem is that platforms don't share the same view of the journey. One system may log a click, another may lose the user after a privacy prompt, and a third may only see the final order. That's why “same campaign, three different numbers” is normal, not exceptional.
Attribution windows add another layer of conflict. A channel with a short lookback window can appear weaker than it really is if buyers take longer to decide. That's one reason attribution should be treated as a directional signal, not a perfect causal map.
Technical setup matters too, because the chain only works if identifiers, UTMs, and conversion definitions are consistent. If those pieces drift, the reports drift with them. The result is not just noise, it's false confidence.
What good founders do instead
The practical response is restraint. Use attribution to compare channels against each other, then keep your budget decisions tied to a stable internal system rather than chasing platform-by-platform perfection.
Don't ask every report to tell the whole truth. Ask each one to help you see a different part of the same customer path.
That's the useful mental model for 2026. You're not looking for one dashboard that settles everything. You're building enough consistency that the differences between dashboards become explainable, manageable, and useful for decision-making.
Your Good-Enough Ecommerce Attribution Setup
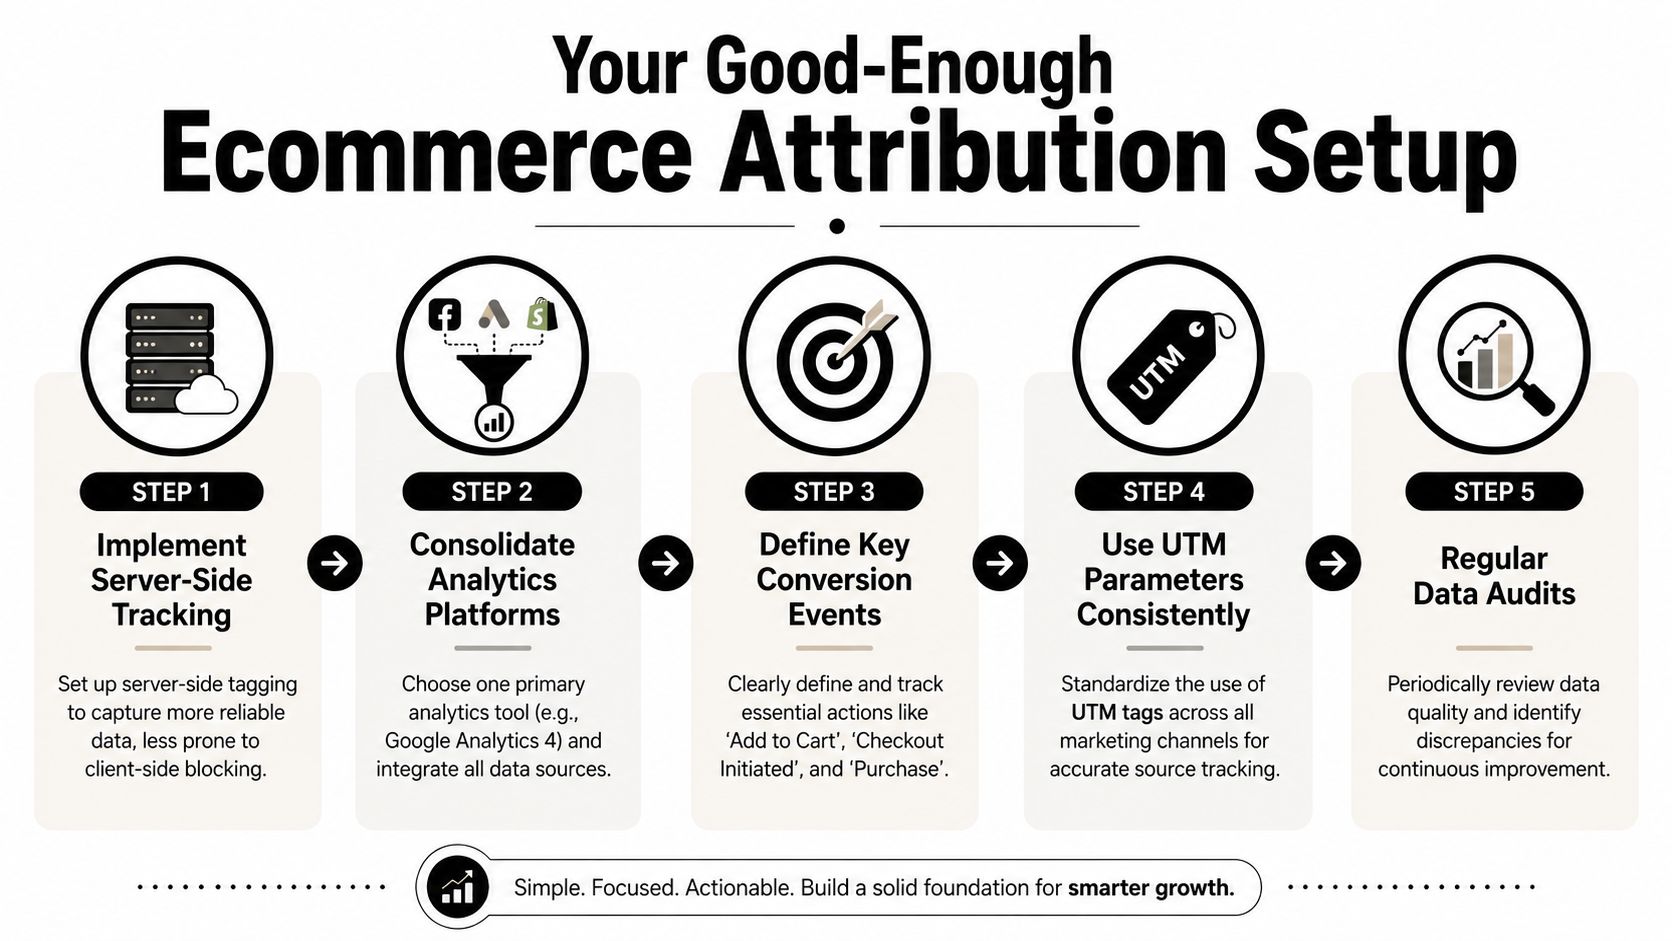
A limited-budget store does not need an enterprise measurement stack. It needs a system that catches most of the truth without turning reporting into a maintenance job. The core principle is simple, tag everything consistently, keep one primary analytics source, and let platform-level and store-level views disagree without breaking your process.
Start with UTM hygiene
Every campaign link should carry source, medium, and campaign at minimum, because inconsistent naming fragments reporting and makes cross-channel comparisons unreliable Cometly on attribution analysis. If one ad is labeled facebook, another meta, and another ig, you have turned one channel into three fake channels.
Use a naming convention you can repeat under pressure. For example, source=meta, medium=paid_social, campaign=product_launch is easier to audit than a spreadsheet full of one-off labels. The point is not elegance, it is consistency.
Keep platform and analytics views separate on purpose
Meta Pixel plus Conversions API gives you a more resilient platform-side signal than pixel-only tracking, especially when browser-side data gets shaky. Google Analytics 4 gives you the neutral journey view, where traffic sources, events, and conversions can be read together. Those two views will not match exactly, and that is fine.
If you want a workflow example for structuring those reports, Social Loop AI is one option that turns a product URL into Meta launch plans and creative batches, then helps founders read results after launch. I would still treat it as one tool in a broader stack, not a replacement for clean UTMs and a primary analytics source.
Define only the events you will use
For a solo founder, the important events are the ones that help you decide whether a campaign is working. That usually means add to cart, checkout initiated, and purchase. If you track too much, you will spend more time reading dashboards than improving offers.
Practical rule: If a metric will not change a budget decision this month, do not make it a core reporting target.
A good-enough setup gives you two useful views. Platform reporting tells you how the ad system sees performance, and Google Analytics tells you how the journey appears across sources. When those views differ, the gap itself becomes a diagnostic tool. If Meta looks strong but your store revenue stays flat, the campaign may be over-credited. If GA4 shows steady assisted traffic but platform ROAS looks weak, the campaign may be doing more upper-funnel work than the platform admits.
How to Interpret ROAS and Allocate Your Budget
Platform ROAS is useful, but it's not enough on its own. If you optimize every decision around one channel's reported return, you can end up starving the campaigns that start demand and keeping only the ones that close it. That's why blended ROAS is the better north star for a solo founder.
The simple formula is total revenue divided by total ad spend. It doesn't pretend to know which channel deserves every dollar of credit. It just tells you whether the business as a whole is producing enough revenue for the money going out the door. For a deeper look at the mechanics of return on spend, this ROAS guide is a useful reference.
Use blended ROAS as the budget anchor
Start with the blended number, then use platform ROAS to ask questions, not to make instant judgments. If Meta ROAS looks strong but blended ROAS is flat, Meta may be over-claiming revenue that would have happened anyway. If Meta ROAS looks modest but blended ROAS improves after you increase spend, the channel may be helping more than its platform report suggests.
That's where the 2026 data matters. A recent report found 34% of teams still use last-touch attribution, and exclusive reliance on that model can misattribute an average of $240,000 in annual media spend because upper-funnel channels influence 48% to 63% of final purchase decisions 2026 attribution report. You don't need to memorize the dollar figure to see the lesson. Ignoring upper-funnel work can make a channel look inefficient right before it starts compounding.
Read the gap, then act
When the numbers disagree, make a simple call. Scale when a campaign is directionally strong across both platform data and revenue, pause when both are weak, and investigate when one looks great while the other stays flat.
Founder heuristic: Trust the blended number for spend ceilings, then use platform data to decide where to investigate, not where to worship.
That approach keeps you from overreacting to noisy attribution. It also gives you a cleaner way to compare creative angles, audiences, and offers without pretending every reported sale is equally certain.
Testing for True Impact with Incrementality
Attribution tells you what was in the path. Incrementality tells you whether the channel added new sales. That distinction matters because a channel can appear in a lot of journeys without being the reason the purchase happened.

The most honest way to use attribution is as a ranking tool. One industry guide puts it plainly, channel attribution is directional, not causal, and it can show a channel receiving 50% of attribution credit while producing only 20% of incremental lift Improvado on cross-channel analytics.
A simple holdout test for a small store
You don't need a giant budget to test impact. Pick one region, one state cluster, or one clearly defined audience segment and hold it out from a campaign while running the same ads everywhere else. If the exposed group grows more than the holdout group, the campaign is likely creating lift.
The important part is keeping the comparison clean. Don't change the offer, landing page, or creative mid-test if you can avoid it. You want to isolate the effect of the media, not the effect of every other variable.
What to look for
The question is not “Did the ad get clicks?” The question is “Would these sales have happened anyway?” That's the whole reason incrementality exists. A channel that looks average in attribution can still be highly valuable if it moves real incremental revenue.
Later in the process, you can pair that test with your normal platform reporting and a neutral source of record. The combination is stronger than any single dashboard because it ties together observed path data and real-world lift.
For a practical walkthrough of how these tests fit into an ecommerce workflow, this incrementality testing guide is a useful next step.
Your Channel Attribution Action Plan
A solo founder does not need perfect attribution to make a better budget call. You need a setup that is consistent, messy in the right places, and good enough to tell you where money is working and where it is being wasted.
Start with the basics, not the fantasy of perfect tracking.
- Audit your UTMs today. Make sure source, medium, and campaign naming are consistent across every live channel.
- Check your primary analytics source. Use one system as the main reference for journey analysis, then compare platform reports against it.
- Confirm your Meta tracking is active. If you're using Conversions API, verify that it's receiving events.
- Calculate blended ROAS for last month. Use total revenue divided by total ad spend, then use that number as your baseline.
- Flag one campaign for an incrementality test. Pick a simple holdout setup and plan it for the next quarter.
- Treat discrepancies as signals. If Meta, Shopify, and GA4 don't match, use the gap to ask better questions instead of forcing one report to win.
The goal is not to make every report agree. The goal is to build a decision stack that helps you spend with confidence, catch channels that are taking too much credit, and protect budget for the campaigns that are driving growth. When the numbers disagree, use blended ROAS as your anchor, use platform reports as directional context, and use one small lift test to check whether a channel is adding revenue or just claiming it.
For a practical walkthrough of how these tests fit into an ecommerce workflow, this incrementality testing guide is a useful next step.
A founder who gets to this point is no longer guessing channel by channel. They are making budget calls from a small set of signals that hold up well enough under pressure, and that is what supports steady growth.