Blog
Meta Ads Reporting That Actually Drives Decisions
Published July 25, 2026
You just launched your first Meta campaign, refreshed Ads Manager, and now you're staring at a wall of numbers that all seem important and none of them tell you what to do next. The spend is moving, the clicks are coming in, and the purchase row looks either too low, too high, or completely unclear. That's the moment where most beginners start reacting to the loudest metric instead of the one that protects budget.
Meta ads reporting works best when it's treated like a decision system, not a scoreboard. The goal is to know what happened, where the problem started, and whether the next move is to scale, pause, or fix tracking before spending another dollar.
Table of Contents
- The First-Launch Reporting Trap Most Beginners Walk Into
- The Measurement Funnel That Makes Every Metric Make Sense
- Building a Tracking Setup That Reports the Truth
- Building Custom Reports in Ads Manager and Beyond
- Metrics That Drive Decisions Versus Metrics That Just Feel Good
- Attribution Governance and Weekly Reconciliation Rituals
- Reporting on Audience Decisions Without Over-Segmenting
The First-Launch Reporting Trap Most Beginners Walk Into
The first time a new dropshipper opens Ads Manager, the account looks like a cockpit. Reach, impressions, clicks, CTR, CPC, purchases, ROAS, frequency, outbound clicks, link clicks, landing page views, results. It's easy to feel like the answer must be hiding in one of those columns, so the instinct is to grab the first bad-looking number and change the campaign.
That usually backfires. A campaign can have weak-looking CTR and still be profitable, or it can get a pretty click rate and fail completely once people land on the product page. Beginners often kill ads too early because they read the report like a scoreboard instead of a diagnosis.
The wrong reflex is to optimize the loudest metric
If the first thing you see is high CPC, you might think the ad is broken. If frequency climbs, you might think the audience is “burned out.” If purchases are delayed, you might think Meta is wasting money when the core issue is that the click never became a real site visit. The table is not lying, it's just incomplete.
The better move is to decide what kind of problem you're looking at before touching the campaign. Is the ad not being seen, not being clicked, not creating qualified traffic, not converting, or converting inefficiently? That's the difference between a useful report and a panic trigger.
Practical rule: don't change the campaign until you know whether the issue sits in visibility, engagement, traffic quality, results, or efficiency.
A structured setup before launch saves money later because it tells you where the loss happened. That matters even more on a tight budget, where one wrong pause can wipe out the only signal you had.
The Measurement Funnel That Makes Every Metric Make Sense
A Meta report makes sense when you read it in order, not in random rows. The reporting funnel moves from visibility to engagement, then traffic quality, then results, and finally efficiency. Meta's own metric structure follows that logic, with Reach, Impressions, and Frequency at the top, then CTR, Clicks, Video Views, and Hook Rate, then Landing Page Views and LPV Rate, then Conversions, Leads, and Purchases, and finally CPC, CPL, CPA, and ROAS. Meta ads metric structure
Read the report from top to bottom
If visibility is weak, the issue is usually delivery, audience size, creative fit, or budget. If visibility is fine but engagement is weak, the ad isn't earning the click. If clicks look healthy but landing page views are thin, the website, page speed, or device experience may be bleeding traffic before the page loads.
That funnel matters because a bad efficiency number doesn't always mean the ad is bad. ROAS or CPA can move because of a problem earlier in the chain, and that's where many beginners miss the cause. A low conversion rate might come from poor traffic quality, not from the product offer itself.
Use the funnel as a diagnosis path
A simple way to read it is this, one layer at a time.
- Visibility: check whether the ad reached enough people to collect meaningful data.
- Engagement: check whether the creative earned attention and clicks.
- Traffic quality: check whether people who clicked loaded the site.
- Results: check whether the traffic converted into purchases or leads.
- Efficiency: check what each result cost.
What works: asking where the funnel broke.
What doesn't: judging a campaign from one isolated row.
If you want a plain-English bridge between raw metrics and decision-making, this guide on confusing ad performance metrics lines up well with the same logic. Use the funnel as your default lens and the rest of the dashboard becomes much easier to read.
Building a Tracking Setup That Reports the Truth
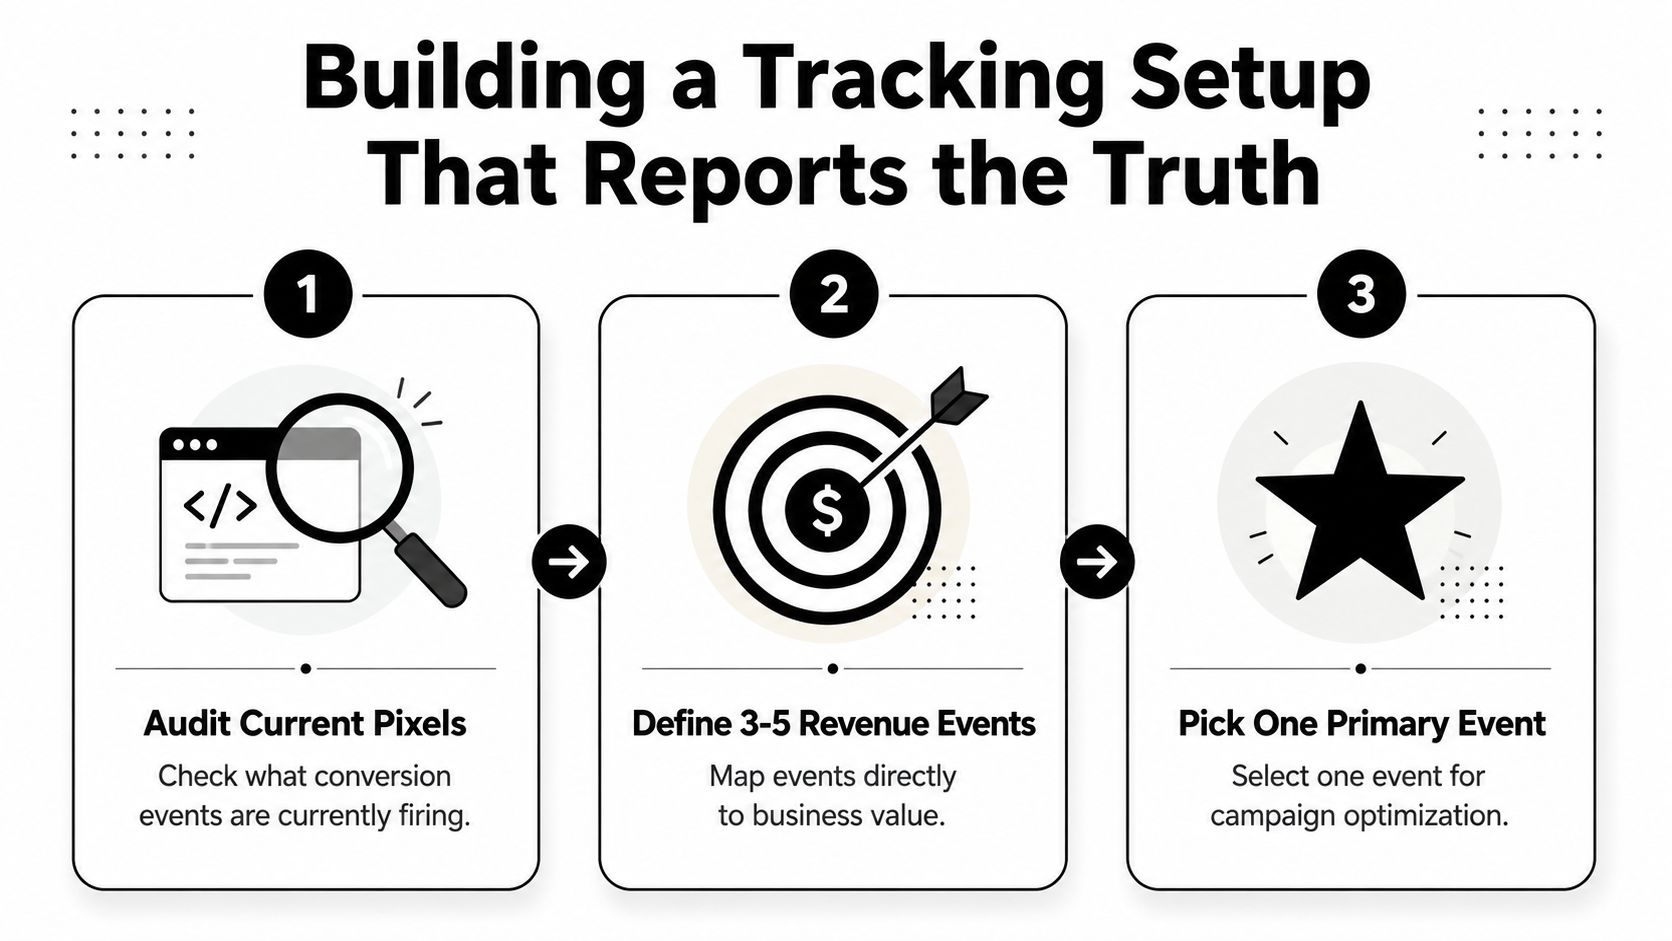
A reporting setup only helps if the numbers can be trusted. Before launch, audit what is already firing, decide which conversion events matter, pick one implementation path, test everything before spend goes live, and document every signal source so the account does not turn into guesswork later. That order is not busywork. It separates learning from paying for noise. Tracking setup sequence
Start with event discipline, not event quantity
Small accounts do not need a giant event map. They need a short list of revenue-linked actions that help the algorithm and keep reporting readable. If every micro-action gets tracked as if it matters equally, the dashboard gets noisy and budget decisions get harder.
A clean setup usually relies on one consistent implementation method, whether that is pixel, Google Tag Manager, or server-side tracking. Mixing methods without documentation creates duplicate signals, missing signals, and mismatches that make people blame the ad when the problem is the plumbing.
Build the pipeline as one system
Browser-only tracking breaks more easily than beginners expect. Privacy controls, blockers, and network issues can interrupt it, which is why the Conversions API matters even on small budgets. It gives the account a second path for conversion signals instead of relying on one browser-side feed.
Before launch, test in staging, check each event source, and write down where each event comes from. After launch, reconcile weekly against the ecommerce platform or CRM. For a practical breakdown of how to spot and handle reporting gaps, the tracking discrepancy guidance gives a useful benchmark for what to investigate first. A 10–15% discrepancy between Meta and the source of truth is considered normal, while anything larger should trigger investigation.
Practical rule: if the report and the backend do not agree, fix the pipeline before you change creative.
For teams that want a structured reporting and launch workflow, data-driven marketing guidance is most useful when it is tied to the actual event map, not just the ad copy.
Building Custom Reports in Ads Manager and Beyond
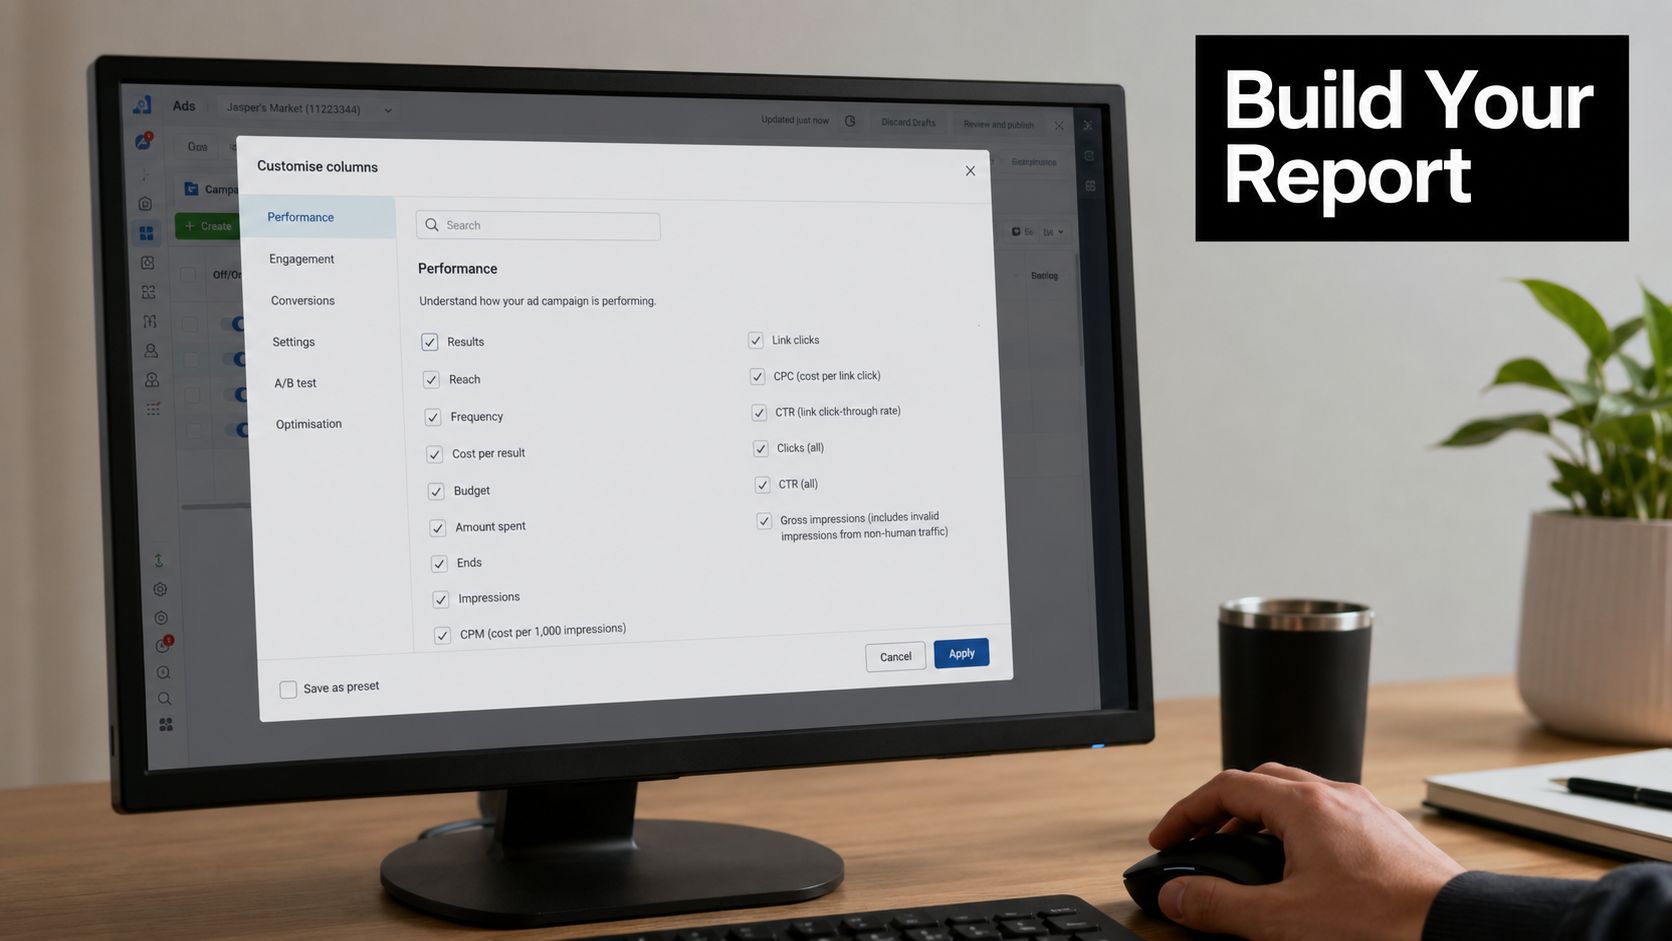
A messy report usually starts with too many columns. Beginners dump in every metric Ads Manager offers, then the useful numbers disappear under rows they never act on. A better setup starts with one saved view built around spend, clicks, conversions, IDs, and the business outcomes that matter to the account. Export that view to CSV, then clean it in Sheets, Excel, or a reporting platform that refreshes on its own. Ads Manager export workflow
Build one column set you can use
A practical starter layout is enough for most small ecommerce accounts.
| Column | Why it matters |
|---|---|
| Amount Spent | Shows what the campaign consumed |
| Purchases | Shows the result count |
| Purchase Conversion Value | Shows revenue tied to reported purchases |
| Cost Per Purchase | Shows acquisition efficiency |
| ROAS | Shows return efficiency |
| Link Clicks | Shows click volume |
| CTR | Shows whether the ad earned attention |
| CPC | Shows the cost of traffic |
| Campaign ID, Ad Set ID, Ad ID | Shows where to slice the data |
That setup keeps the report readable. It also keeps the numbers tied to account structure, so you can compare ads without guessing which level produced which result.
Export once, refresh daily
The manual path still works at the start. Pull the CSV from Ads Manager, then organize it in Google Sheets or Excel. Once the account needs faster checks, connect the reporting layer directly through OAuth so it refreshes daily without downloading files by hand.
Once the report is clean, add breakdowns only when volume justifies the split. Age, gender, placement, and device help when they answer a real question. They waste time when they are just available in a dropdown. A lot of bad analysis starts when a beginner slices the data until every row looks important, but none of it leads to a decision.
Metrics That Drive Decisions Versus Metrics That Just Feel Good
The easiest way to waste time in Meta ads reporting is to treat every metric as if it deserves the same level of attention. Some numbers tell you what to do. Others tell you why the first numbers moved. Those are not the same job.
Separate decision metrics from diagnostic metrics
Decision metrics answer a direct budget question. Diagnostic metrics explain the behavior behind the decision. If the report can't tell you whether to scale, pause, or retest, it's not being used properly.
| Metric | Function | When to Act On It |
|---|---|---|
| ROAS | Revenue efficiency | Use it to decide scale or pause |
| Cost Per Purchase | Acquisition efficiency | Use it when purchases are the main goal |
| Cost Per Lead | Lead efficiency | Use it when lead generation is the goal |
| Conversion Rate | Outcome quality | Use it when traffic exists but results lag |
| CTR | Click appeal | Use it to diagnose creative response |
| Hook Rate | Early attention | Use it to diagnose opening strength |
| LPV Rate | Traffic quality | Use it when clicks don't become site visits |
| Frequency | Exposure pressure | Use it to check audience fatigue |
The beginner mistake is easy to spot. Someone pauses an ad because CPM looks high, even though purchase cost is strong. Someone scales an ad because CTR looks exciting, even though it produces no purchases. In both cases, the wrong metric got promoted to decision-maker.
Let the right metric hold the power
If ecommerce sales are the goal, Cost Per Purchase and ROAS deserve more weight than vanity-friendly clicks. If the ad has traffic but no downstream results, then CTR, LPV Rate, and Frequency help you diagnose where the loss happened. The report should move you toward a budget call, not just reassure you that the ad was seen.
Useful habit: every metric you check should answer one of two questions, did it help money come in, or did it explain why money didn't come in?
That's why the best reports are short enough to read quickly and deep enough to diagnose the problem. A crowded dashboard feels advanced. A clean one saves money.
Attribution Governance and Weekly Reconciliation Rituals
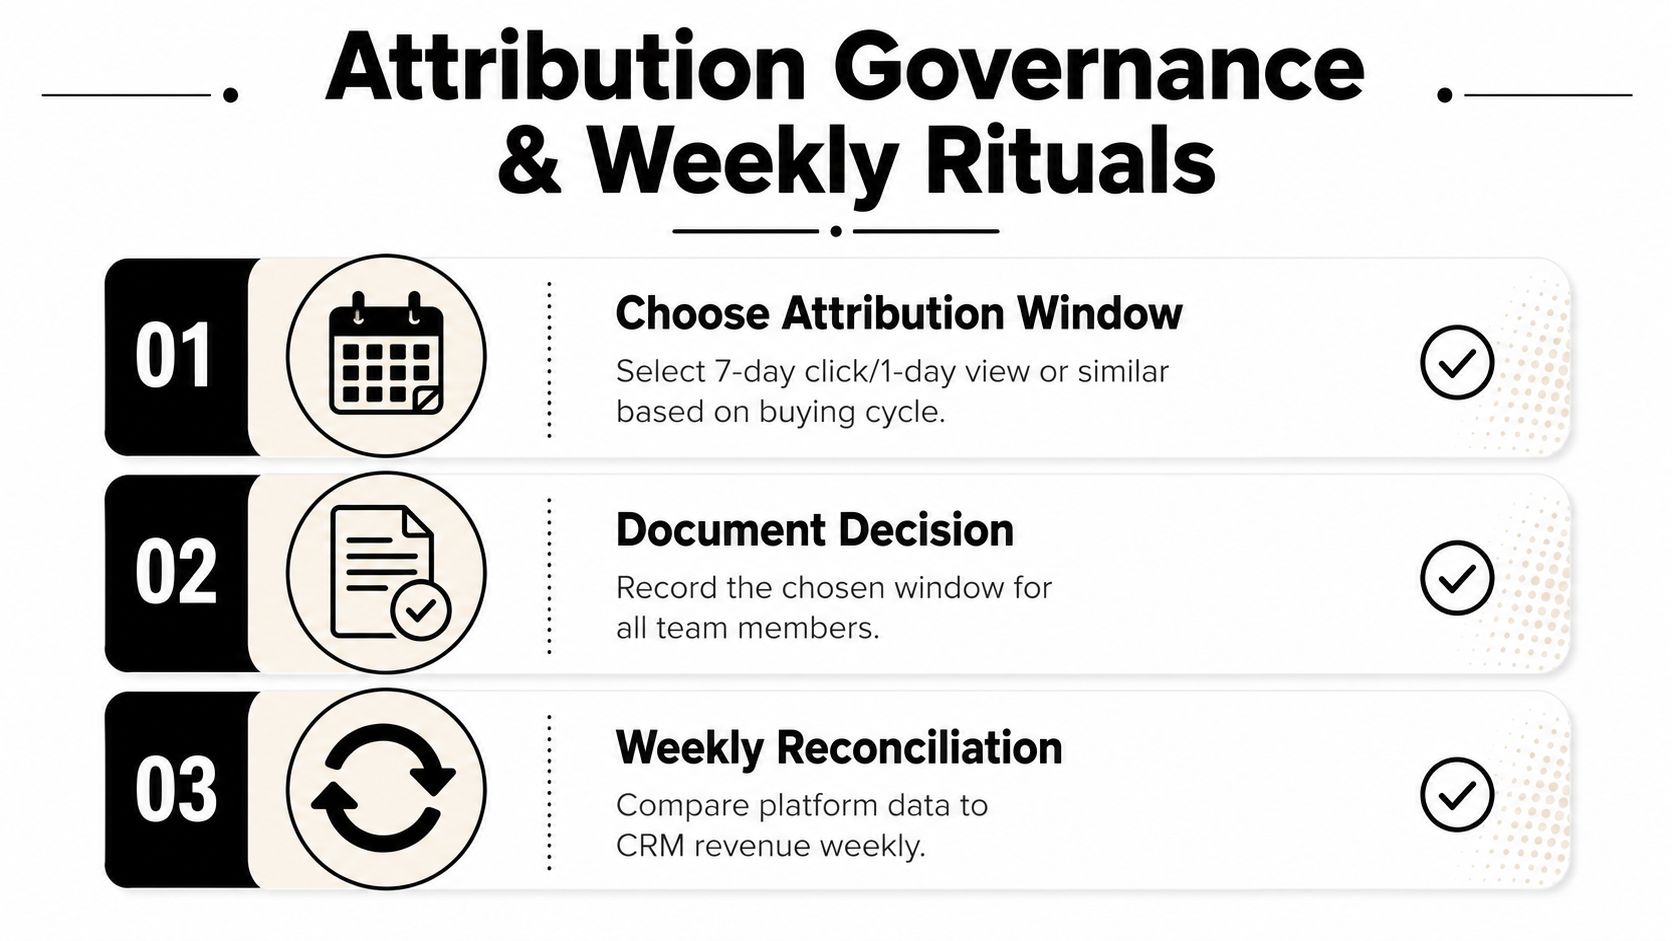
A messy report usually starts with a sloppy attribution rule. Pick the window on purpose, tie revenue to your CRM or payment processor, and keep Meta in the role it plays, which is signal source and optimizer, not the final ledger. Weekly reconciliation works better than daily checks because one bad day can just be noise, while a full week shows whether the setup is drifting. Attribution governance guidance
Make the window match the buying cycle
Impulse products and considered purchases need different reporting rules. A short window can fit fast buyers, while a longer window fits people who click, leave, and come back later after thinking it through. Set the rule before the campaign runs, then leave it stable long enough to compare one week with the next without changing the math midstream.
The backend still has to win the argument. The store, checkout system, or CRM shows what sold, while Meta shows how the platform credited those sales. If the two numbers stay far apart, the report stops helping budget calls and starts turning into a platform-vs-backend debate.
Reconcile on a schedule and look for drift
A stable Meta-overcount ratio around 1.2:1 can be workable, but movement toward 2.5:1 usually points to deduplication trouble or modeling issues. Those gaps matter because they tell you whether the mismatch is small enough to live with or big enough to inspect. Attribution challenge guidance
Use a weekly ritual with three checks.
- Window check: confirm the attribution setting is still the one you intended.
- Revenue check: compare Meta-reported results with CRM or payment processor revenue.
- Drift check: flag any unusual mismatch and inspect the tracking path.
A good reconciliation habit keeps a small account from making emotional decisions off incomplete data. It also gives you a record when someone asks why Meta says one thing and Shopify or WooCommerce says another.
For a practical framework on aligning platform and backend reporting, channel attribution guidance keeps the conversation tied to revenue instead of platform-only numbers.
Reporting on Audience Decisions Without Over-Segmenting
Audience reporting gets messy when the structure itself is messy. If three ad sets overlap heavily, the report can't tell you which audience is carrying the account. That's why clean comparisons matter more than clever segmentation. Independent guidance recommends splitting audiences into separate ad sets for clean comparison, checking overlap percentages, and using breakdowns plus delivery diagnostics to decide whether broad targeting or Advantage+ performs better than layered interest stacks. Audience comparison guidance
Clean tests beat blended guesses
A beginner often stacks multiple interests into one ad set because it feels efficient. In practice, that blurs the result. When the report comes back, no one can tell whether the audience worked because of one interest, one overlap pattern, or just because the creative happened to hit.
Separate ad sets make the comparison cleaner. Overlap percentages help you see whether two audience groups are competing for the same people. Breakdown views then show whether the audience is behaving differently across device, placement, or other useful slices.
Practical rule: if you can't explain why one audience should beat another, don't keep adding segments to force a theory.
Use reporting to decide the next budget move
Broad targeting, Advantage+ audience, and layered interest stacks can all win in the right setup. The report should tell you which one deserves more budget, not which one looks smartest on paper. If the structure is too blended, the decision becomes emotional instead of analytical.
A simple test plan keeps that from happening. Launch separate ad sets, keep the comparison clean, watch overlap, and read the delivery diagnostics before touching budget. Then use the result to choose one action, scale, pause, or retest.
A report that ends without a clear move is just a screenshot. A report that points to the next budget decision is doing its job.
If you want a reporting stack that connects campaign data, account structure, and conversion signals without spending your nights in spreadsheets, set up Social Loop AI and use it to turn your Meta account into something you can read before your next budget decision.