Blog
Statistical Significance Explained: For E-commerce Success
Published June 12, 2026
You launch two Meta ad creatives for the same product. By the end of the day, one ad has a few more purchases than the other. Your first instinct is simple. Kill the loser, scale the winner.
That instinct is exactly where many new store owners start wasting money.
Small differences in results often feel meaningful because you're looking at them through the stress of ad spend, deadlines, and hope. But ad platforms are noisy. Some clicks come in bunches. Some buyers convert later. Some audiences just happen to be more active on one day than the next. A few extra purchases can reflect a real edge, or they can be random wobble.
That's where statistical significance becomes useful. Not as an academic ritual, but as a filter for better decisions. If you're testing ad creatives, landing pages, headlines, or product page layouts, you need a way to separate a pattern from a lucky streak.
This guide gives you statistical significance explained in plain English, with one goal in mind: helping you make better ecommerce decisions. Not just “Is this result real?” but also “Is it big enough to matter for my store?”
Table of Contents
- Introduction Why "Lucky Guesses" Wont Scale Your Store
- What Is Statistical Significance Really Asking
- The Metrics That Matter P-Values Alpha and Confidence Intervals
- Why Significance Is Not Enough Effect Size and Practical Impact
- A Practical Guide to Interpreting Your AB Test Results
- Applying Significance to Your Meta Ad Campaigns
- Common Traps to Avoid P-Hacking and Sample Size
Introduction Why "Lucky Guesses" Wont Scale Your Store
You spend money on two creatives for the same product. Creative A gets a handful of sales. Creative B gets a few more. That feels like a clear answer, especially when your budget is tight and you want momentum.
But ecommerce data rarely arrives in a clean, stable way.
A small store often sees results in clumps. One buyer clicks in the morning and converts at lunch. Another adds to cart and comes back later. A third never buys, but still inflates your click numbers. When traffic is limited, normal randomness can make one ad look better for a moment even when there's no durable difference.
The decision behind the data
The issue isn't “Which ad won today?” Instead, the core question is whether the observed gap is large enough, and stable enough, to justify changing your budget.
That matters because every premature decision has a cost:
- Pause the wrong ad: You might kill a creative that would have performed better over a fuller test.
- Scale the wrong audience: You can push more budget into a result that was mostly noise.
- Rewrite the wrong landing page element: You might spend hours fixing a button color when the actual problem is weak product positioning.
Practical rule: If a result would have changed your budget decision, it deserves more scrutiny than a quick glance in Ads Manager.
New business owners often think statistics are for analysts, researchers, or enterprise teams. In reality, basic statistical thinking is most valuable when money is scarce. If you only have a limited testing budget, you can't afford to treat every short-term jump as proof.
That's why statistical significance explained for ecommerce has to go beyond textbook language. You don't need formal jargon first. You need a decision framework. You need to know when the data is whispering, when it's saying something useful, and when it's still too early to trust.
What Is Statistical Significance Really Asking
Statistical significance answers one simple question:
Could this result have happened by random chance, even if there were no real difference?
That's the core idea. Everything else is vocabulary wrapped around that question.
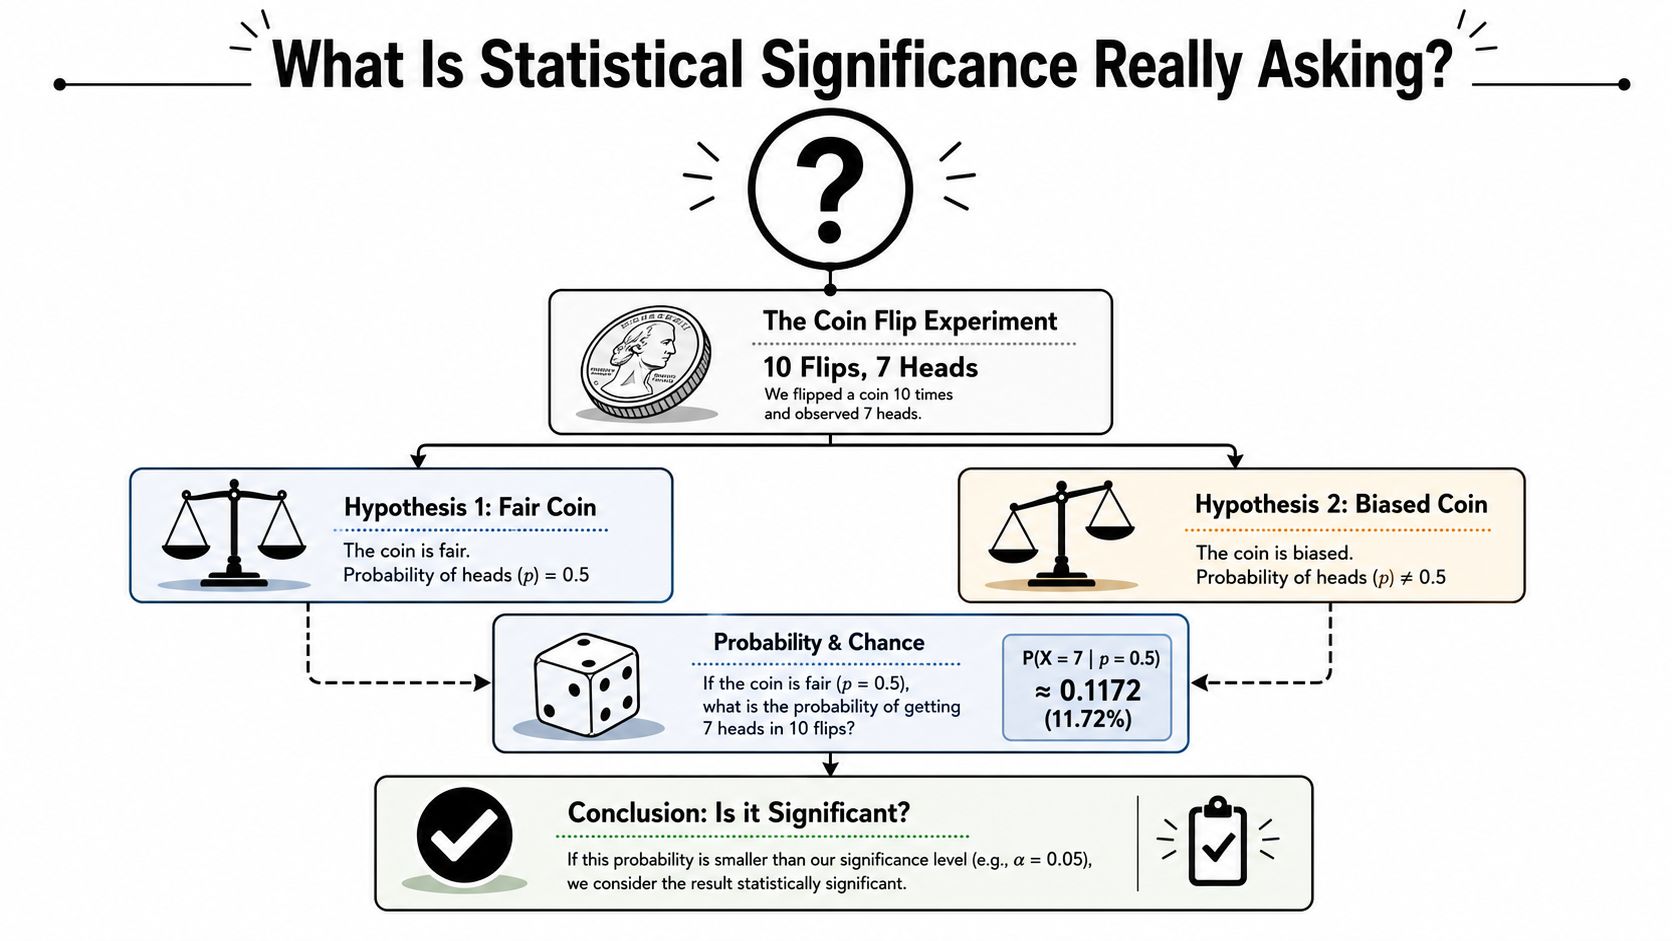
A coin flip is the cleanest way to understand it. Suppose you flip a coin several times and see more heads than tails. Does that prove the coin is biased? Not necessarily. Weird-looking outcomes happen sometimes, even with a fair coin.
The boring default assumption
Statistics starts with a default position called the null hypothesis. Think of it as the boring explanation.
With the coin, the boring explanation is: the coin is fair.
With an A/B test, the boring explanation is: there is no real difference between version A and version B.
With two Meta ad creatives, the boring explanation is: neither creative is better. The gap you saw came from normal randomness.
That default matters because your data has to earn the right to overturn it. Statistical significance is the filter that asks whether your observed result is unlikely enough under that default assumption.
Why this matters in ecommerce
Say one ad gets more purchases than the other. Without statistical thinking, it's tempting to conclude that the better-looking ad has a superior hook, image, or message.
Sometimes that's true. Sometimes it isn't.
A few extra purchases can happen for messy reasons:
- Timing effects: One ad got shown during a better part of the day.
- Audience wobble: The platform delivered to slightly different pockets of people.
- Plain randomness: A small number of buyers can swing results sharply.
The test result is not asking, “Do I like this outcome?” It's asking, “Would this outcome be surprising if there were no real difference?”
That's the heart of statistical significance explained in practical terms. It doesn't prove a winner with certainty. It helps you judge whether the pattern is strong enough that chance alone looks less convincing.
For a store owner, that mindset shift is huge. Instead of chasing every tiny lead change, you start asking a more disciplined question: “Is this enough evidence to act?”
The Metrics That Matter P-Values Alpha and Confidence Intervals
You launch an A/B test on your product page. Version B gets more purchases by Tuesday, and your first instinct is to send all traffic there.
Before you do that, you need three tools that help you read the result without fooling yourself: p-value, alpha, and confidence interval. These are statistics terms, but for a store owner they answer three practical questions. How surprising is this result? What standard did I set before the test? How big might the lift be?
P-value as a surprise meter
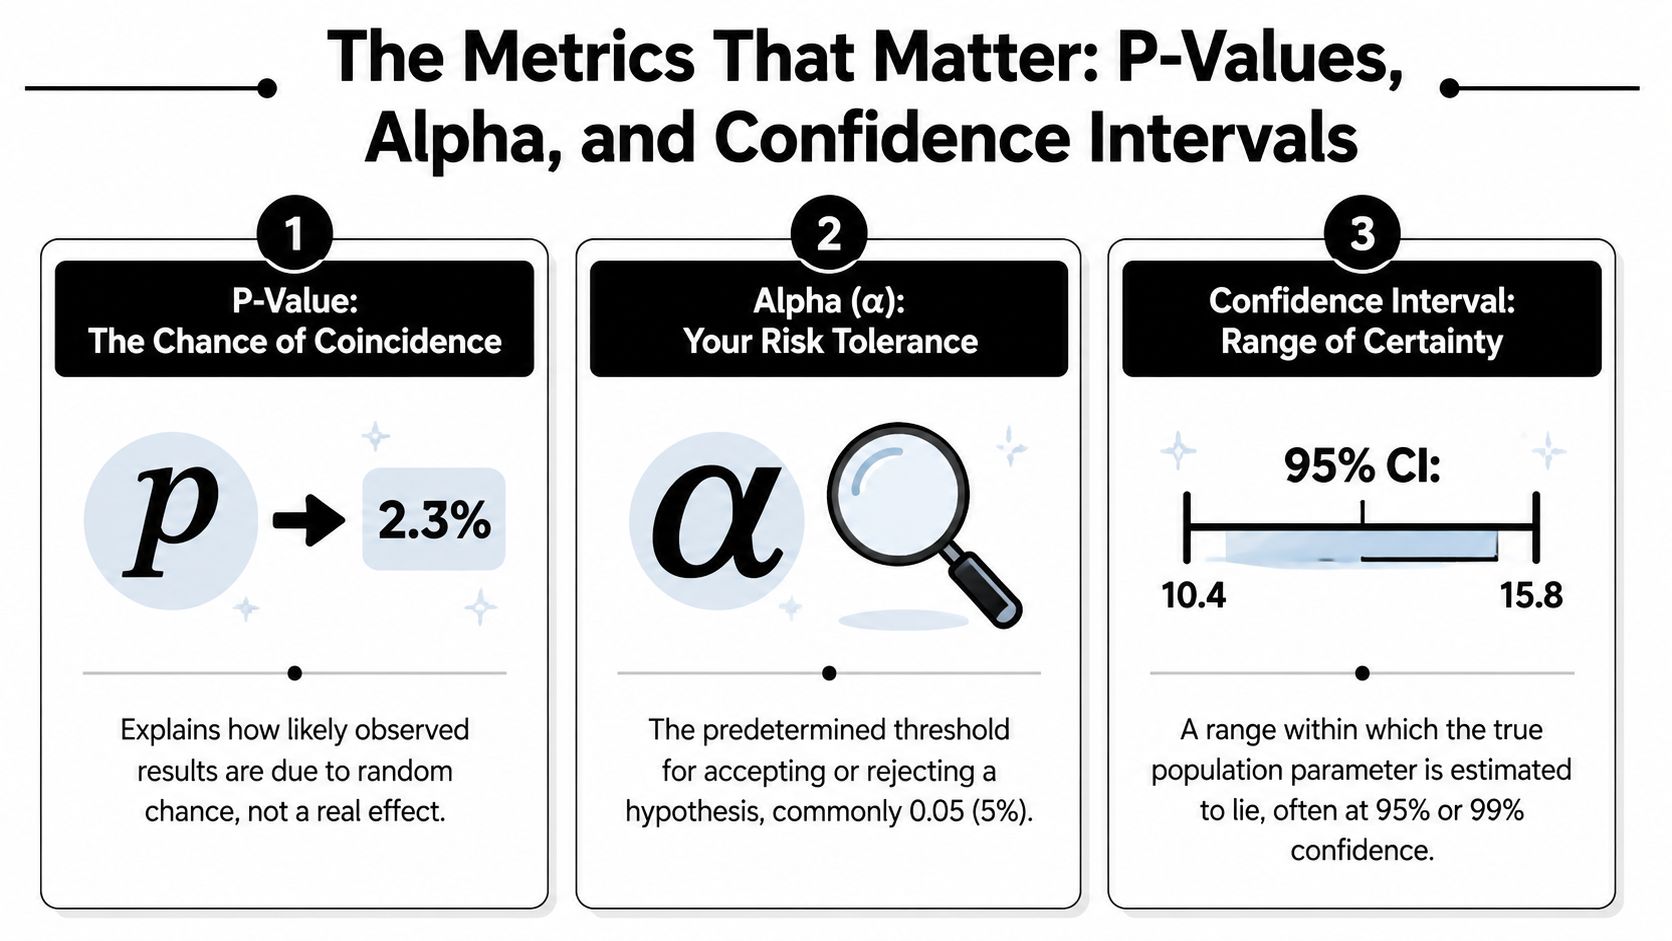
A p-value measures how surprising your observed result would be if there were no real difference between A and B.
A coin-flip analogy helps here. If you flip a fair coin 10 times and get 7 heads, that feels a little unusual, but not shocking. If you flip it 10 times and get 10 heads, you pay attention. A p-value works in a similar way. Lower p-values mean your test result would be harder to explain as ordinary randomness alone.
For an ecommerce owner, that matters when one ad creative, landing page, or offer appears to pull ahead. A low p-value does not tell you that the winner is huge, profitable, or permanent. It tells you the gap is less consistent with a lucky streak.
That distinction saves money. If you only look at the top-line conversion rate, you can end up shifting budget based on noise. If you need a refresher on the business numbers underneath these tests, this guide to ad performance metrics for ecommerce teams gives helpful context.
Alpha as the rule you set before results arrive
Alpha is the cutoff you choose in advance for calling a result statistically significant.
Many tests use 0.05 as the default threshold. In plain language, you are deciding how much false-alarm risk you are willing to tolerate before declaring a winner. A lower alpha means you are asking for stronger evidence.
The timing matters as much as the threshold. You set alpha before checking the results, the same way you would set a spending limit before opening Meta Ads Manager. If you wait until you see a promising result and then adjust the rule, you are no longer being disciplined. You are looking for permission to believe what you already want to believe.
Confidence intervals as the range around the estimate
A confidence interval shows a range of plausible values for the true effect.
This is often the most useful metric for real business decisions because it adds scale and uncertainty at the same time. A p-value may tell you the result is unlikely to be random. A confidence interval helps you judge whether the likely improvement is large enough to matter for your store.
Suppose Version B is ahead. The confidence interval might suggest the true lift is small, moderate, or close to zero. That range changes the decision. A narrow range gives you more precision. A wide range tells you the test still leaves a lot unresolved.
| Metric | What it tells you | Business use |
|---|---|---|
| P-value | How surprising the result would be if there were no real difference | Helps judge whether chance is still a believable explanation |
| Alpha | The decision threshold chosen before the test | Keeps you from changing the rules after seeing the outcome |
| Confidence interval | A plausible range for the true effect size | Helps judge risk, upside, and how much uncertainty remains |
One practical habit helps a lot. When your A/B test tool reports a winner, do not stop at the label. Check the p-value, confirm the alpha you intended to use, and read the confidence interval as if you were deciding whether to put real ad dollars behind the result.
That is how abstract statistics become useful in day-to-day ecommerce decisions.
Why Significance Is Not Enough Effect Size and Practical Impact
You run an A/B test on a product page and the tool marks Version B as statistically significant. That feels like a green light. For a store owner, the harder question comes next. Is the lift large enough to change what you do with your page, your creative, or your ad budget?
That is the gap between statistical significance and business significance.
A result can be real and still too small to matter
Effect size is the size of the difference you found. Practical impact is whether that difference earns its keep in practical situations.
A coin-flip analogy helps here. If you flip a coin enough times, you can detect a tiny tilt, like one side landing slightly more often than the other. That difference may be real. It still would not matter if you were deciding whether to bet serious money on it. Ecommerce tests work the same way. A tiny lift can clear the statistical bar and still be too small to cover design work, implementation time, or extra media spend.
Sample size is part of the story. Large samples can detect very small differences. Small samples can miss useful ones. As explained in this guide to sample size, significance, and practical impact, statistical significance answers whether chance is still a reasonable explanation. It does not answer whether the result is worth acting on.
For a new ecommerce store, that distinction protects cash.
A 0.3 percent lift in conversion may be statistically significant. If your margins are thin or your traffic is inconsistent, that lift may not justify a full page rebuild or a new creative direction in Meta. On the other hand, a moderate lift that improves revenue per visitor can deserve action even if the rollout takes work.
What practical impact looks like in a store decision
After you confirm a result is statistically credible, switch from analyst mode to owner mode. Ask questions tied to profit and effort:
- Does the lift improve contribution margin, not just conversion rate?
- Will this change hold up after added costs like design, dev time, or higher CPMs?
- Does it matter at your current traffic level, or only in theory?
- Would you still care about this result if you had to apply it across multiple products or audiences?
Those questions keep you from treating every detected difference like a win.
They also help when your test includes more than one major change. If a page test mixes a new headline, new images, and a new offer layout, even a significant result can be hard to use because you cannot tell which change created the value. In those cases, a more structured approach to multivariate testing for ecommerce pages can make the result easier to act on.
Significance answers one question. Your business needs two.
A useful way to frame it is simple:
- Statistical significance: Is this likely to be more than random noise?
- Practical impact: Is the upside large enough to justify a decision?
Both matter. Only one pays the bills.
If a test result would not change your bid strategy, budget allocation, product page rollout, or creative plan, it has limited business value no matter how clean the statistics look. Smart store owners do not stop at "significant." They ask, "Significant enough for what?"
A Practical Guide to Interpreting Your AB Test Results
Let's move from theory to a store decision.
Suppose you're testing a product page change on Shopify. Not a full redesign. Just one element. Maybe the hero headline, maybe the add-to-cart button text, maybe the order of your product benefits.
A product page test example
You create two versions:
- Version A: Your current product page
- Version B: A revised version with one major change
That “one major change” matters. If you alter the headline, the images, the button, and the reviews block all at once, you won't know what caused the outcome. If you want to test multiple elements together, multivariate testing for ecommerce pages is the more accurate framework.
Now you let the test run and your tool reports three things: an observed uplift, a p-value, and a confidence interval.
At this point, individuals often jump straight to the uplift. That's natural. It feels concrete. But it's incomplete.
How to read the result without fooling yourself
A better reading process looks like this:
- Check the setup first. Did you test one meaningful change, send comparable traffic, and keep the test conditions reasonably stable?
- Look at the p-value next. This tells you whether chance is still a strong explanation.
- Read the confidence interval. If the plausible range is very wide, uncertainty is still high.
- Ask whether the uplift matters. Even if the result is statistically real, does it improve a metric you care about?
- Translate the result into an action. Scale, keep testing, or leave the current version in place.
A frequently underexplained part of statistical significance explained is the gap between statistical and practical significance. Many explainers mention that a result can be statistically significant even when the effect is small, especially with large samples, but stop short of helping people judge whether it matters for business decisions. That gap matters because large samples can make tiny effects look significant and mislead decision-makers, as discussed in this video explanation of statistical versus practical significance.
Here's a quick interpretation table you can use:
| What you see | What it may mean | Best next move |
|---|---|---|
| Low p-value, narrow confidence interval, meaningful uplift | Strong evidence and useful business impact | Consider rolling out the winner |
| Low p-value, tiny uplift | Probably real, but maybe not worth acting on | Compare against implementation effort |
| High p-value, large-looking uplift | Promising, but still uncertain | Keep testing or gather more data |
| Wide confidence interval | Too much uncertainty remains | Avoid bold decisions yet |
Don't ask only, “Did B beat A?” Ask, “How sure am I, and would this difference actually change the business?”
That question keeps your tests tied to outcomes, not vanity wins.
Applying Significance to Your Meta Ad Campaigns
You launch two Meta ad sets on Monday. By Tuesday afternoon, one has a cheaper cost per purchase, so you feel tempted to shift budget fast. By Thursday, the other ad set catches up, and now the “winner” depends on which hour you check.
That is the practical version of statistical significance for an ecommerce owner. It is less about textbook formulas and more about one practical question. Is this result stable enough to trust with your ad budget?

Comparing ad sets without overreacting
Meta Ads Manager shows many numbers at once. Spend, clicks, CPM, CTR, CPA, purchases, and ROAS can all move in different directions. That makes it easy to crown a winner too early.
A better approach is to treat each ad set like a coin you are still flipping. After three flips, getting two heads does not prove the coin is special. After many flips, patterns mean more. Ad performance works the same way. A small conversion gap with very few purchases can disappear as more data comes in.
When you compare ad sets, focus on three checks:
- Volume: Did each ad set generate enough conversion data to make the comparison less noisy?
- Fairness: Did both ad sets get delivery, or did one stay stuck in limited learning and never get a real chance?
- Business quality: Does the cheaper result still bring the kind of customer you want, or is it only cheaper on the surface?
That last point matters more than many new advertisers expect. One audience can win on CPA and still lose on profit if those buyers return less often, buy lower-value products, or refund more. If you want a clearer framework for tying ad results to financial decisions, this guide to marketing spend optimization for ecommerce campaigns is a useful next read.
When to scale, pause, or retest
Meta usually does not hand you a p-value inside the dashboard, but the decision logic is still the same. You are judging whether a performance gap is probably real enough, and large enough, to justify action.
Use this rule of thumb:
- Scale when one ad set keeps leading on the metric that matters most to the business, with enough conversion volume that the lead no longer looks fragile.
- Pause when an ad set repeatedly wastes spend on the outcome you care about, such as purchases or profitable customer acquisition.
- Retest when the difference looks promising but still behaves like a coin flip.
Here is the practical filter. A green number is not a budget decision by itself.
Suppose Creative A has a slightly lower CPA, but only from a handful of purchases. Creative B has more spend, more purchases, and similar economics once results settle. In that case, B may be the safer budget home, even if A looked prettier in one column for a day. Statistical thinking helps you avoid paying tuition to randomness.
If you test many creatives, audiences, and hooks at the same time, one apparent winner can rise just because you gave chance more opportunities to produce a flattering result. Meta advertisers run into this constantly, especially during rapid creative testing.
This short walkthrough adds another useful lens for campaign review:
The practical takeaway is simple. Shift budget only when the result looks steady, lines up with the metric that drives margin, and would make a meaningful difference to the store. Statistical significance helps you judge whether the lift is likely real. Your business judgment decides whether that lift is worth paying for.
Common Traps to Avoid P-Hacking and Sample Size
A new store owner launches two ad creatives on Monday. By Monday afternoon, one is up. By Tuesday morning, the other pulls ahead. By Tuesday night, the first one looks like the winner again.
That kind of whiplash is normal in small samples.
The trap is turning those early swings into budget decisions. In ecommerce, that often means pausing a potentially strong creative too soon, or scaling a weak one because it had one lucky day.
The danger of peeking too early
Early test results work like a few coin flips. If you flip a coin six times, getting four or five heads does not mean the coin is biased. It means you have very little data. A/B tests behave the same way at the start. A handful of purchases can make one ad look far better than it really is.
P-hacking is what happens when you keep checking and stop the test at the exact moment the result looks good enough to celebrate. You are not measuring a stable difference. You are catching randomness mid-swing.
For a new ecommerce owner, the cost is practical. You can move budget into a creative that will not hold up, then spend the next week wondering why yesterday's winner suddenly got expensive.
Too many tests create fake winners
Now add volume. You test five headlines, four hooks, three audiences, and two offers. Even if none of them is meaningfully better, one combination can still rise to the top by chance alone.
That is why statistical significance needs context. A low p-value can be useful, but it is not a magic stamp that says, "safe to scale." The risk of a false positive goes up when you run many comparisons, keep changing the test, or search the dashboard until something looks impressive.
This shows up constantly in Meta ad accounts. Rapid creative testing is useful, but it also creates more opportunities for a random standout. The more shots you take, the more careful you need to be about calling one shot the winner.
A simple discipline checklist
You do not need advanced math. You need rules you set before the test starts.
- Pick one main success metric: Decide whether this test is about CPA, conversion rate, CTR, or another metric tied to profit.
- Choose a review point in advance: Set a minimum sample size or a fixed test window before you look for a winner.
- Limit what changes: If you swap headline, image, audience, and offer at the same time, you will not know what caused the result.
- Treat early leads as tentative: A fast start is a clue, not a verdict.
- Ask whether the lift matters to the business: A statistically real change still needs to improve margin enough to deserve more spend.
- Retest high-stakes findings: If the result will change budget allocation or creative strategy, confirm it before acting on it.
Good testing habits protect your ad budget from noise. That is the core purpose of statistical significance for ecommerce. It helps you separate "this looked good today" from "this is likely to keep helping the store."
If you're launching Meta ads for the first time and want a clearer way to plan tests, structure rounds, and decide what to scale, Social Loop AI helps turn your product URL into a practical ad launch system built for new ecommerce owners.